Select the chart type that matches the comparison.
Figure redesign from raw data
Modelling & Data · Data Analysis
Report-figure and table preparation turns approved analyses into clear, consistent, accessible outputs with correct units, uncertainty, labels, legends, significant figures, and a traceable connection to source data.
Why this service
Report-figure and table preparation turns approved analyses into clear, consistent, accessible outputs with correct units, uncertainty, labels, legends, significant figures, and a traceable connection to…
Figure redesign from raw data
Multi-panel composition and annotation
Automated table and figure generation
Choose the scope
The method, preparation route and reporting depth depend on what you need to decide.
Select the chart type that matches the comparison.
Show uncertainty and sample size accurately.
Keep visual styling consistent without changing the data.
Common outputs
Fields, conditions, processing and file formats are confirmed before work begins.
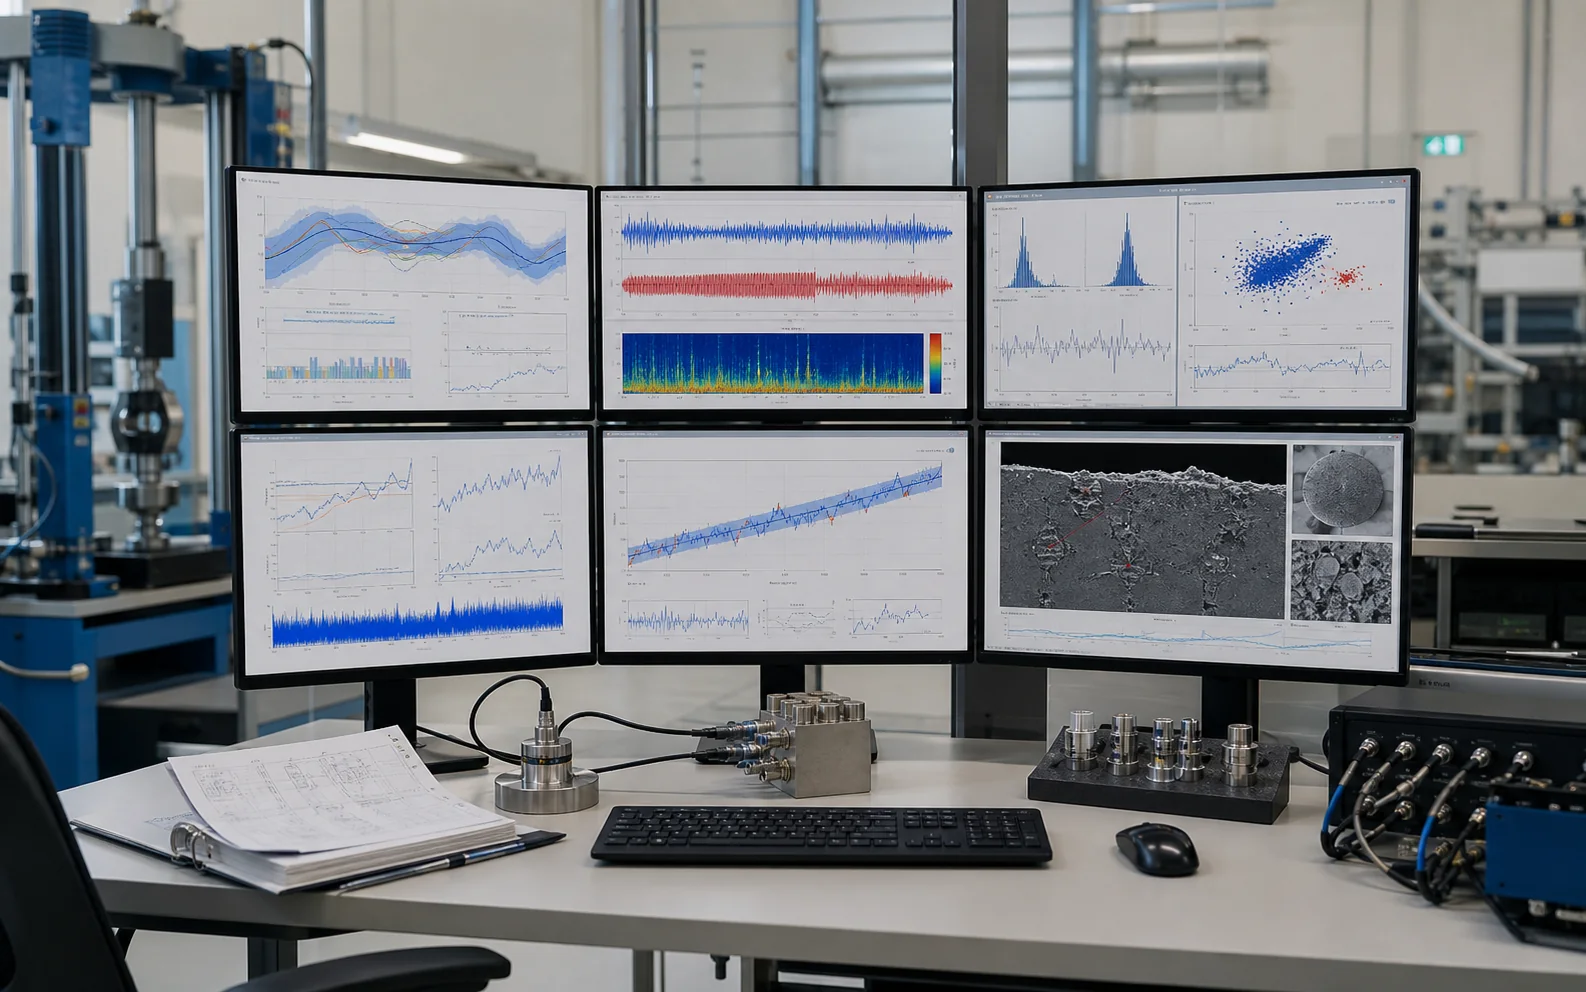
A representative output from Report Figures and Tables with agreed units, labels, and revision status.
Checks, tolerances, convergence, uncertainty, or inspection evidence appropriate to the service.
A concise interpretation connecting the deliverable to the customer decision.
Input requirements
Provide representative, clearly labelled inputs and identify the decision, feature or comparison that matters.
| Suitable input | Submission requirement | Planning note |
|---|---|---|
| Project input or design file | Provide the current design, objective, constraints and required deliverables for technical review. | Declare confidentiality, file, access or delivery constraints in advance. |
Objective: state the decision, comparison or acceptance criterion the work must support.
Handling and access: declare hazards, instability, confidentiality, file constraints or special logistics before dispatch or transfer.
Questions and answers
Short answers to issues that can change preparation, scope, timing or interpretation.
Raw, unedited data in a machine-readable format; preserve original files and metadata.
Start with Figure redesign from raw data; the final option is confirmed against the required decision and acceptance criteria.
Typical outputs include publication-ready figures, formatted result tables, editable source files. Final files follow the confirmed reporting scope.
Delivery timing is confirmed after the project inputs, scope and dependencies have been reviewed.
Request a project quotation
Typical turnaround: Confirmed after project review
Request a quote