Nanoscale chemical identity
point spectroscopy
Material Analysis · Microscopy & Imaging
Characterise nanoscale chemical identity, topography and local mechanical response, and chemical-domain size and distribution using a scope agreed around your sample and decision.
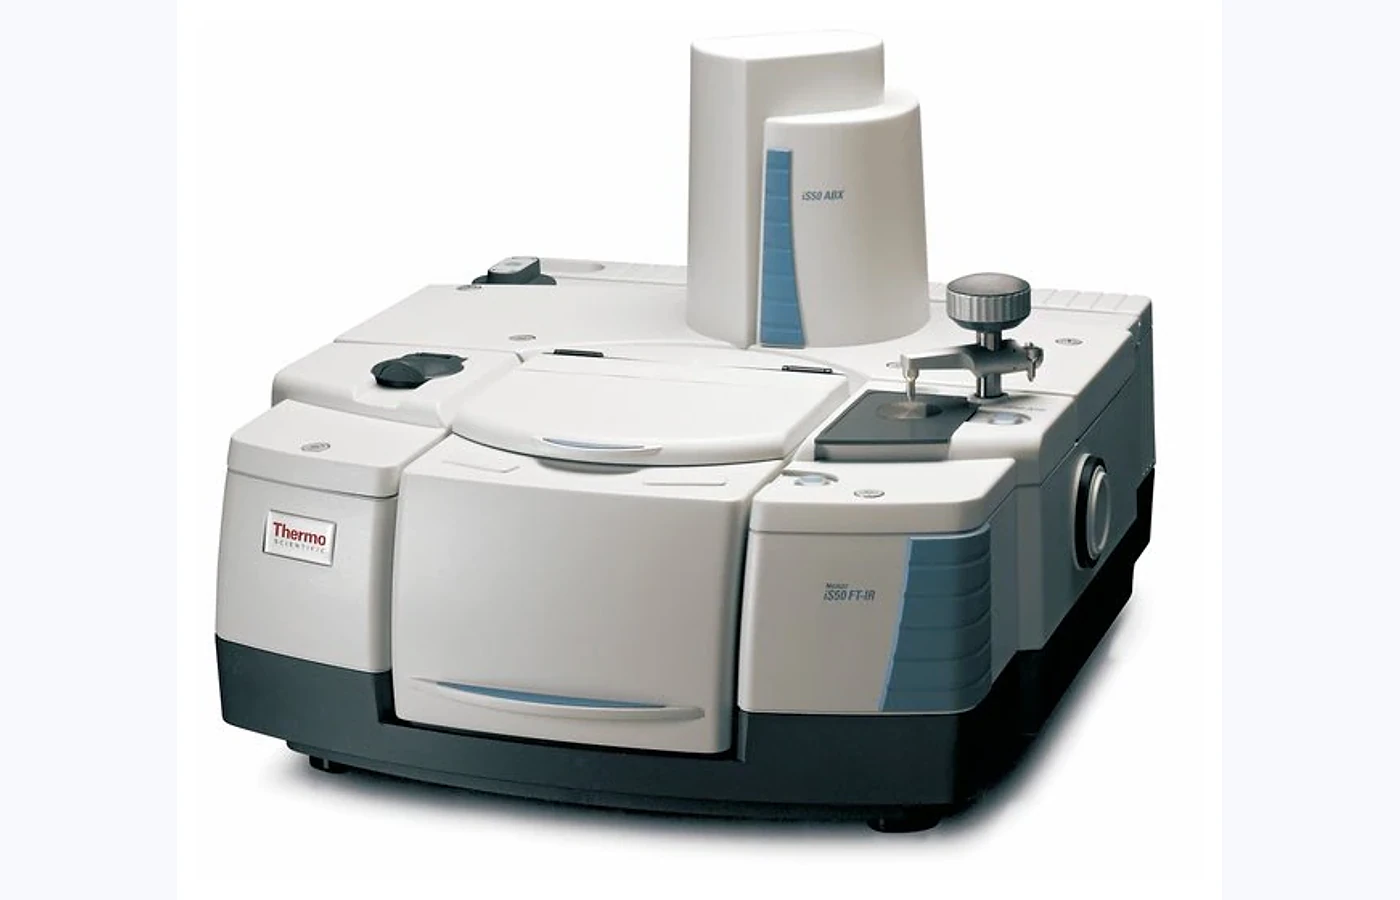
Why this test
AFM-Infrared Spectroscopy is selected when the project needs defensible information on nanoscale chemical identity, topography and local mechanical response, or chemical-domain size and distribution. AFM-IR detects…
point spectroscopy
chemical imaging
correlative nanomechanical or electrical mapping
Choose the scope
The measurement mode, preparation route and reporting depth depend on what you need to learn from the sample.
nanoscale chemical identity
topography and local mechanical response
chemical-domain size and distribution
Common outputs
Fields, measurement conditions, processing and file formats are confirmed before work begins.
AFM topography reported with the agreed units, sample reference and measurement conditions.
Point nano-IR spectra supplied in a labelled format suitable for direct sample or condition comparison.
Chemical-intensity maps and correlation overlays provided with the processing basis and quality checks agreed during technical review.
Method-specific images included when selected in the confirmed reporting scope.
Sample requirements
Provide representative, clearly labelled samples and identify the region, feature or comparison that matters.
| Suitable sample or input | Submission requirement | Planning note |
|---|---|---|
| Powder / particles | Provide a dry, homogeneous and clearly labelled sample in a sealed container. | Exact mass and any drying or dispersion step are confirmed after technical review. |
| Film / coating | Provide the coated substrate or a flat film with the test surface and coating side clearly marked. | State the substrate, nominal thickness and whether sectioning or mounting is permitted. |
| Test coupon / specimen | Provide labelled specimens prepared to the agreed geometry, orientation and surface condition. | Confirm the applicable standard, dimensions, loading direction and number of replicates. |
| Solid / component | Provide a clean, stable and clearly labelled specimen with the target face or region identified. | Confirm dimensions, cutting permission and whether the original geometry must be preserved. |
Region of interest: include a marked image, sketch or reference when the target feature is localised.
Handling: declare hazardous, magnetic, volatile, moisture-sensitive, beam-sensitive or temperature-controlled material before dispatch.
Questions and answers
Short answers to issues that can change preparation, scope or interpretation.
Provide powder / particles, film / coating, test coupon / specimen, solid / component as applicable. Exact quantity, dimensions and preparation are confirmed during technical review.
Choose the mode around the decision you need to make. For nanoscale chemical identity, start with point spectroscopy; add chemical imaging when comparison or quantification is required.
Typical turnaround is 6 working days after sample acceptance and method confirmation.
Strong roughness, poor thermal contact, or weak absorption can reduce signal. Results sample a shallow local area and require representative site selection.
Configure the service
A £45 service fee applies to orders under £300, excluding VAT.
Typical turnaround: 6 working days
Configure & Book